


Continuous Waveform recording is a powerful tool for power system diagnostics however it can generate a tremendous amount of data. PV II™ software has features that do a lot of the tedious work for you so that you can concentrate on the analysis.
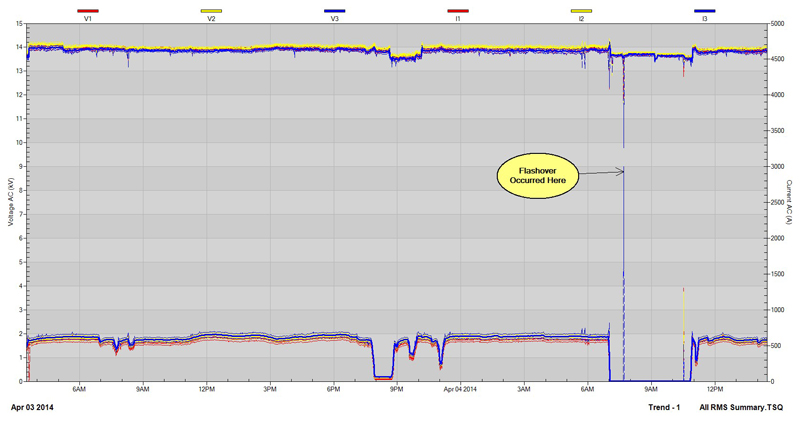
The following example is from an industrial setting where a breaker feeding a 27MVA active front end variable frequency drive opened due to a downstream flashover. The PQPro™ was monitoring this breaker using Continuous Waveform recording. Three phase voltages and currents were recorded at 256 samples per cycle – every cycle.
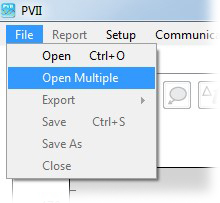
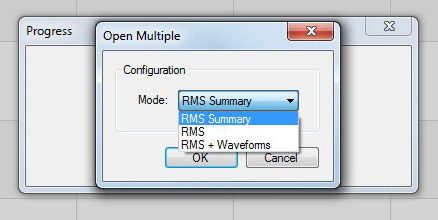
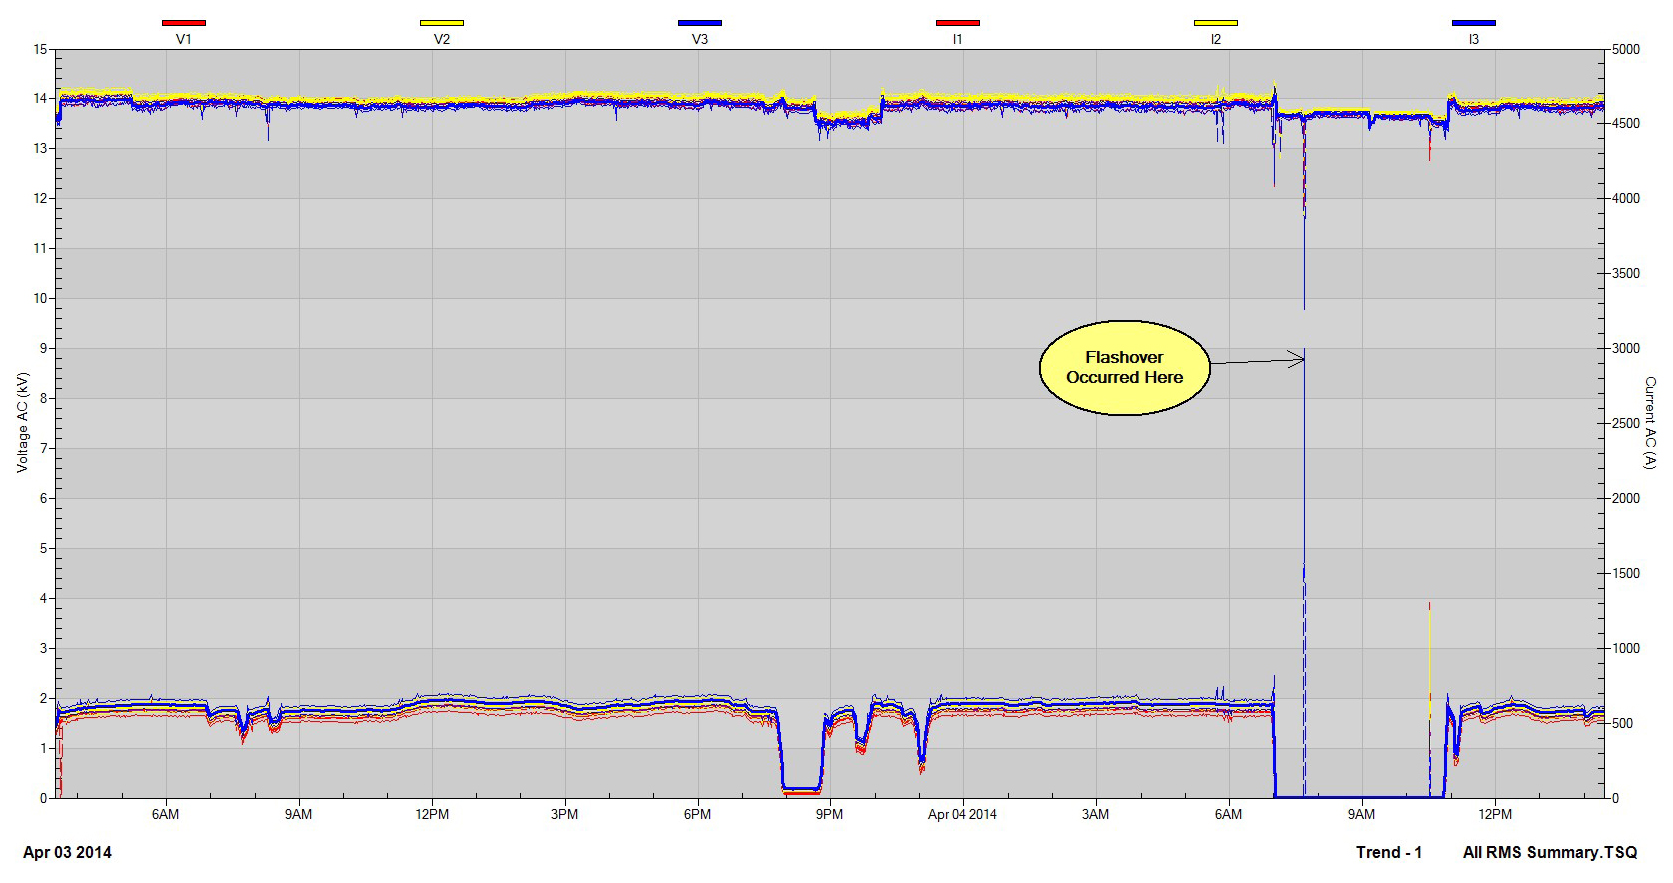
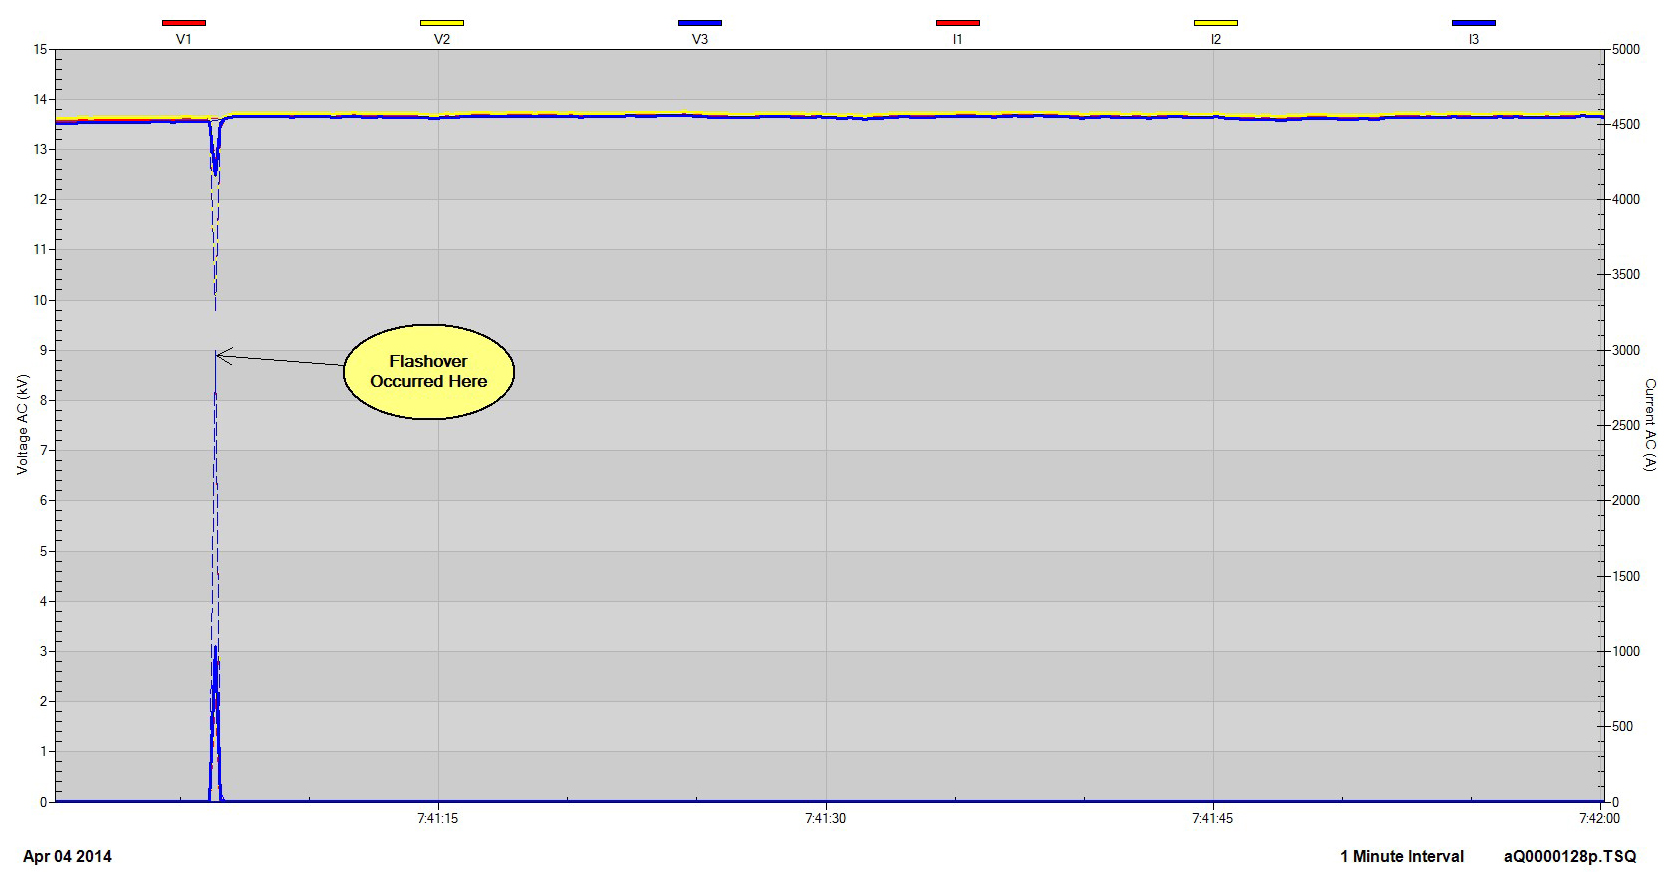
Each recorded data file is 500 MB with a new file started when the previous file is full. There is no gap between the files and PV II™ has the ability to read in multiple files and “stitch” them together into one seamless file. In this example there are 57 files for a total of 28 GB of data. Every cycle for all six channels was recorded for over 35 hours. This amount of data would be very difficult to work with all at one time. PV II™ has the ability to go through all the data files and extract a summary of the RMS values and save it to a much smaller file. In this case the summary data file is only 1 MB. From this summary RMS deviations as short as ½ cycle in duration can be quickly identified.
The summary file does not include any waveform data however PV II™ can quickly find that data for you. Zoom in on the current transient for better resolution and right click on the graph where the transient is. The software will ask if you want to open the full resolution data file (RMS + Waveform) for that transient.
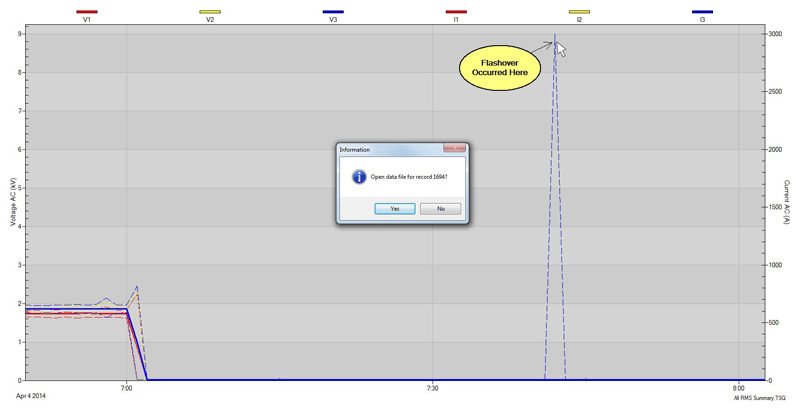
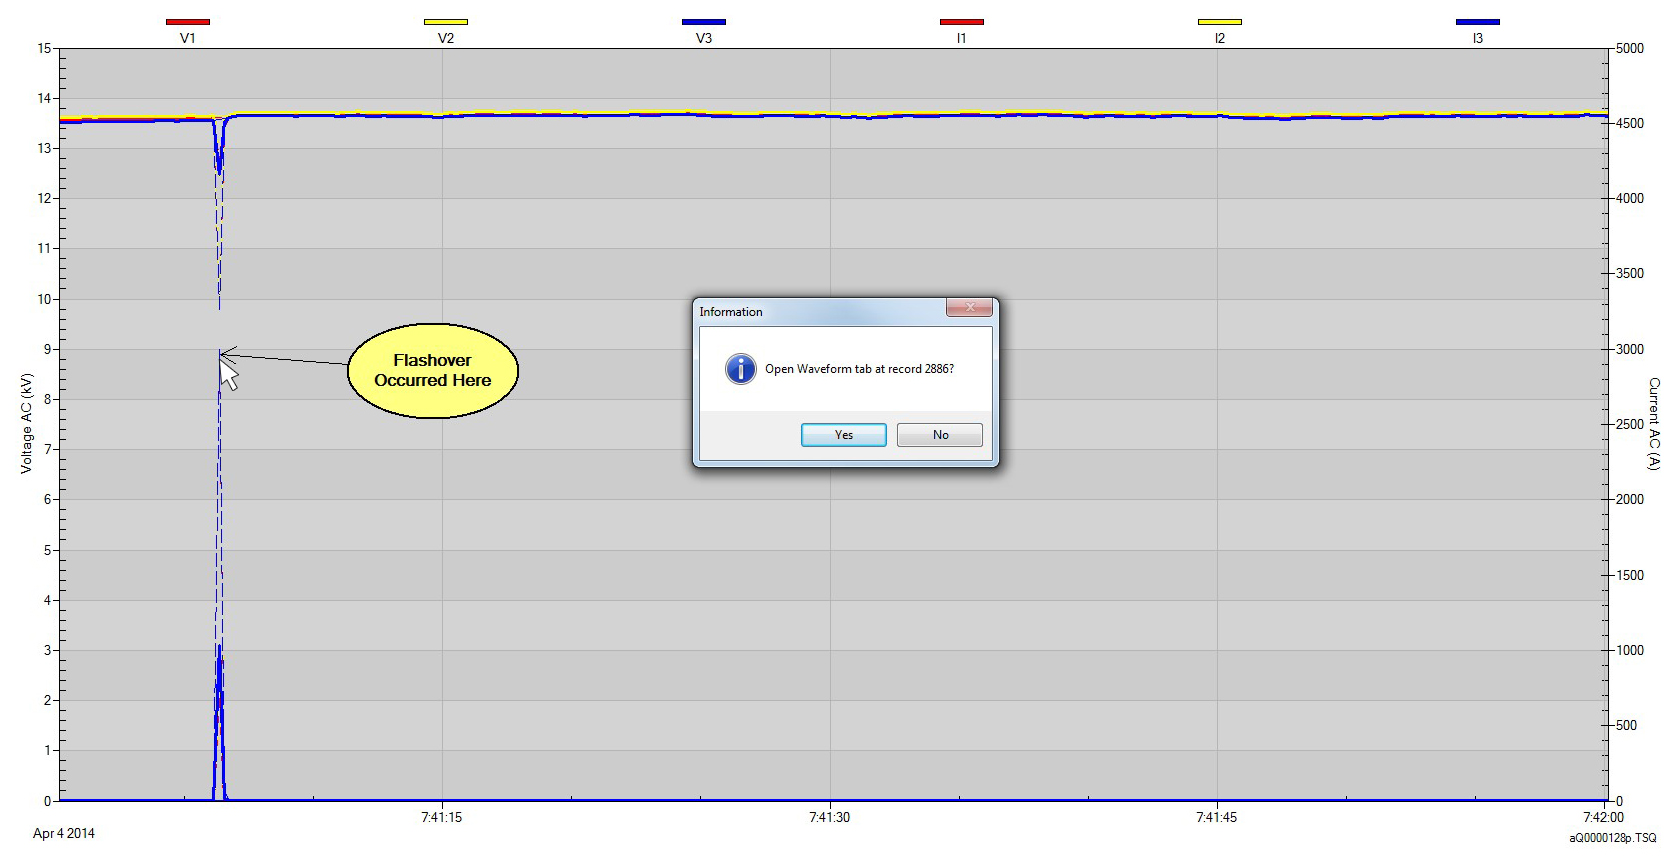
Click 'YES' and PV II™ will launch a new instance and opens a single 500 MB data file with full RMS and Waveform resolution. A page with one minute of full resolution RMS data will be displayed.
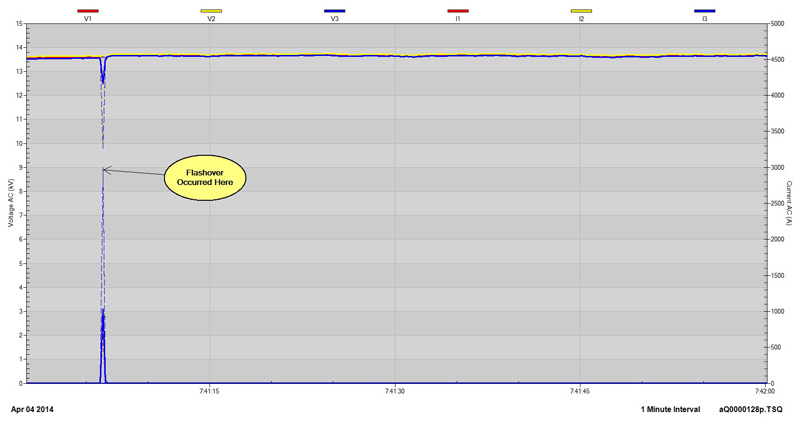
To open the waveforms, right click on the graph where the transiet is. This time the software will ask if you want to open a new waveform tab.

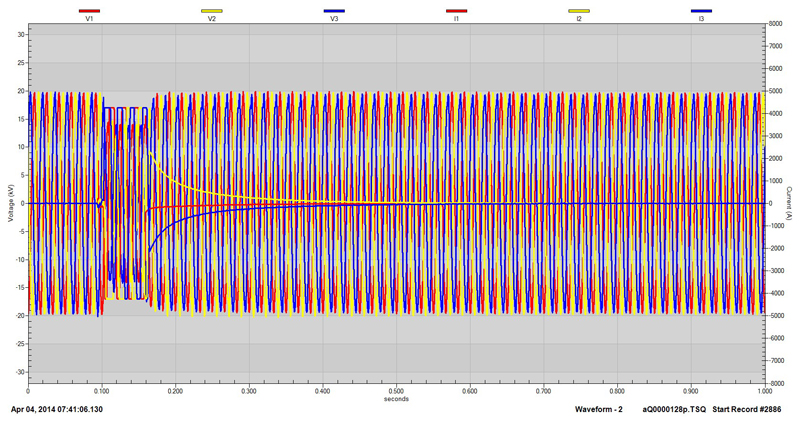
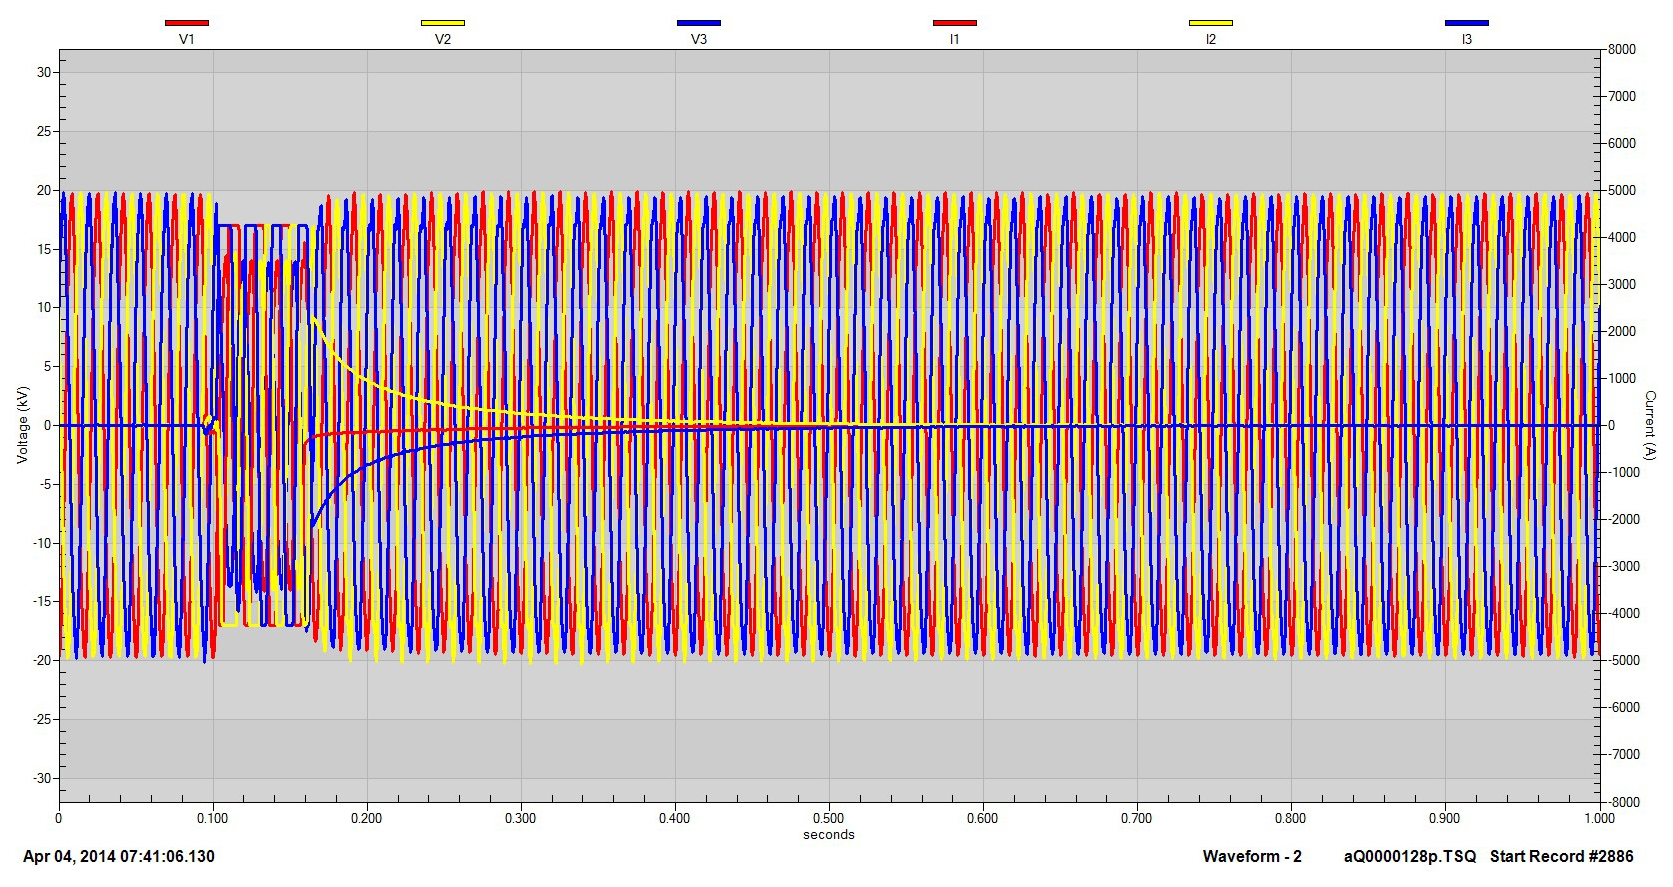
Confirm 'YES' and a new waveform tab will be opened showing the voltage and current waveforms at the time of the transient.
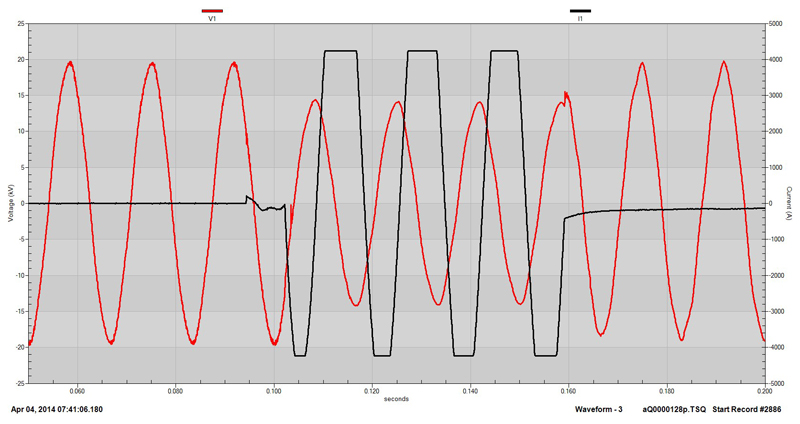
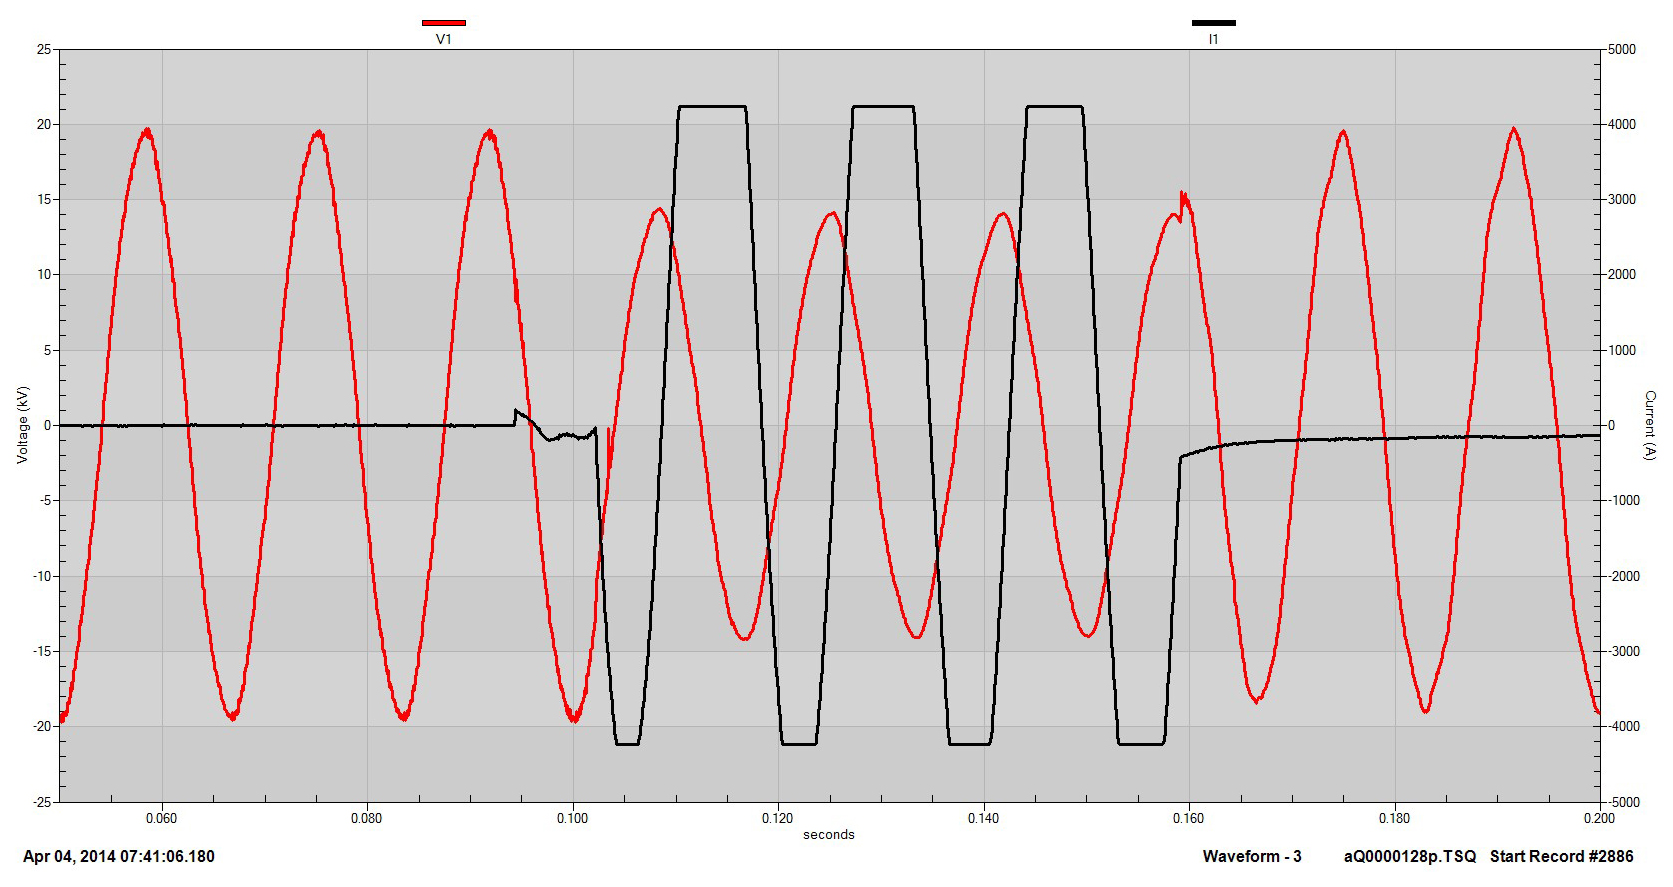
The waveform graph can be formatted and re-scaled to show the transient more clearly.
The current waveform is flat topped indicating that the fault current was greater than the measurement capability. This overcurrent is not harmful to the PQPro™ or the current sensor.
Even though there was a tremendous amount of data drilling down to see high resolution waveform data of a transient takes very little time.