


Case Studies > Using Measured & Calculated Neutral Currents To Find Grounding Issues
Some engineers distrust calculating neutral current from a measurement of three phase currents however it may not always be possible to put a current clamp around the neutral line and, as will be discussed later, comparing measured with calculated neutral current can quickly identify grounding issues.
RMS values of the three phase currents cannot be used to accurately calculate neutral current however waveform data can be used to precisely calculate neutral current. To test this a PQPro™ was used with 10A clamp CTs for phase currents and a 30A clamp CT for neutral current. The test load was a set of 3 CFL bulbs that generated significant current harmonics. Ten turn coils were used on each phase and neutral to magnify the small CFL currents.
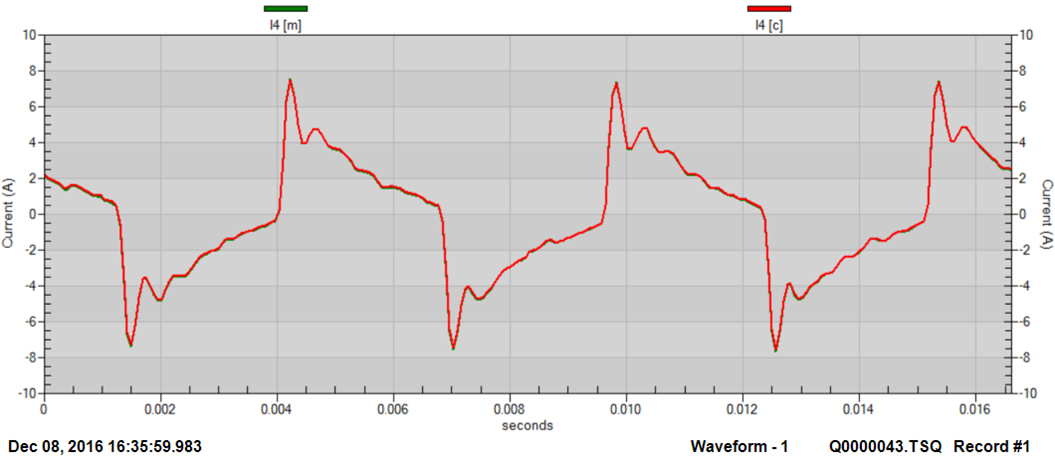
PVII™ software, which is used for displaying and analyzing PQPro™ data, can display both measured and calculated neutral current at the same time. Following are waveform and RMS graphs for measured and calculated neutral currents. The precision is such that one trace is overlaid on top of the other.
 Figure 1: Neutral current waveform measured (green trace) and calculated (red trace).
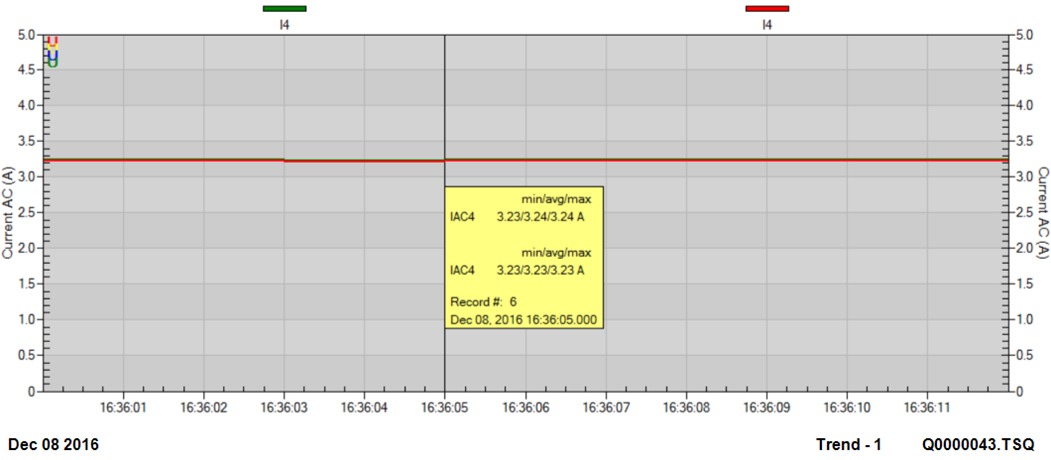
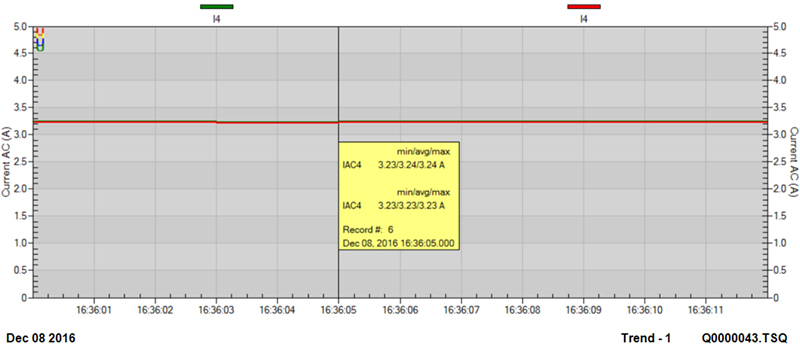 Figure 2: Neutral RMS current measured (green trace) and calculated (red trace).
In a three phase four wire power system with a balanced load and without harmonics there will be no current flowing in the neutral wire. If the load is unbalanced and/or there are triplen (3rd, 9th, 15th etc.) harmonics in the phase currents there will be current flowing in the neutral. Typically the neutral wires in a building will all connect to ground at one central place, usually at the main distribution panel. Wiring errors or insulation breakdown can allow neutral currents to shunt to ground without going through the neutral conductor. This is not a safe situation. Comparison of the measured and calculated neutral current can quickly identify this situation. Following is an example from a data centre distribution panel.
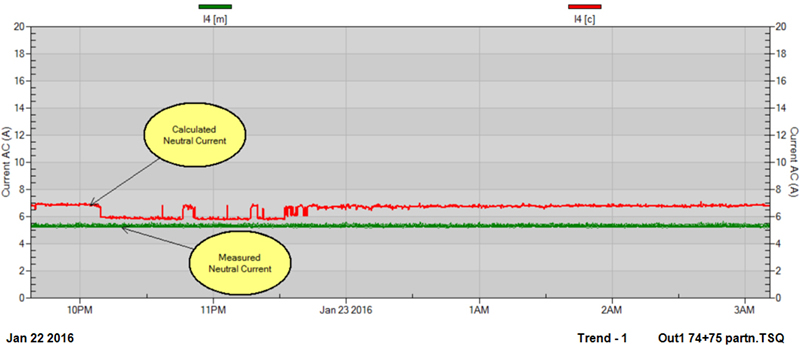 Figure 3: Neutral RMS current, measured and calculated.
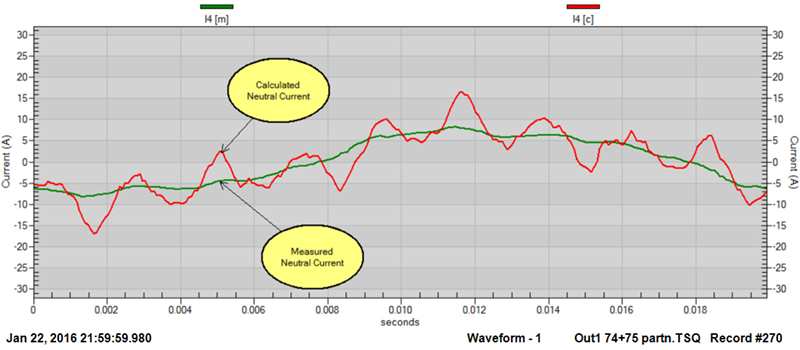 Figure 4: Neutral current waveform, measured and calculated.
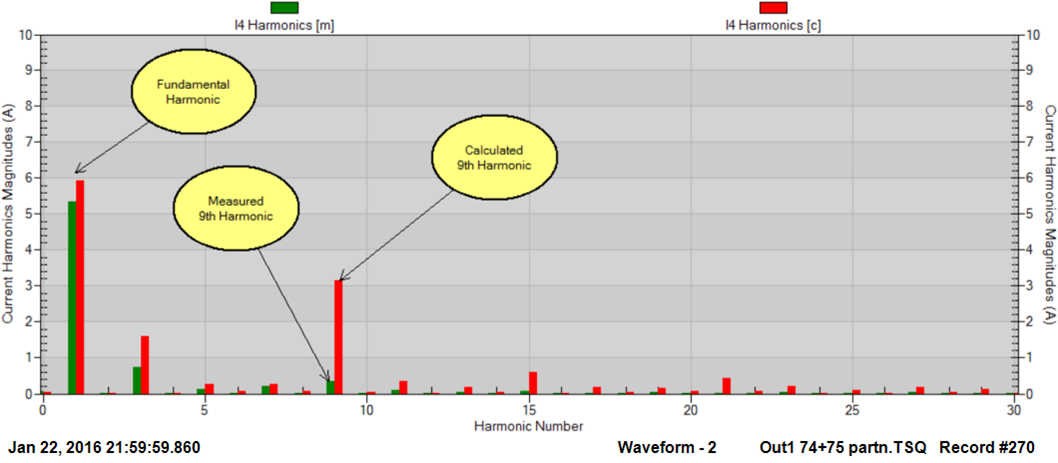
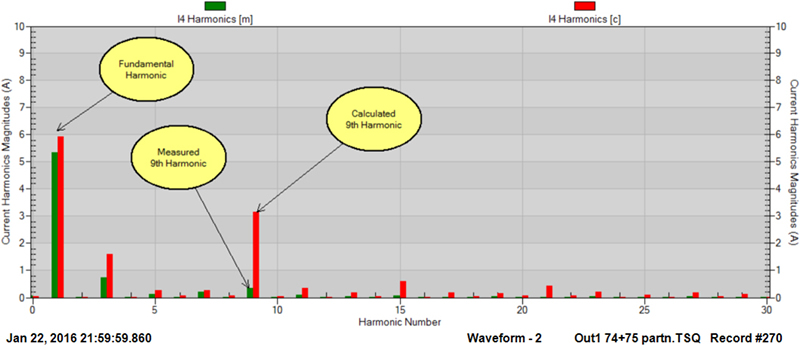 Figure 5: Neutral current harmonics, measured and calculated.
The above graphs show that a downstream load has neutral current that is leaking directly into ground instead of going through the neutral conductor. From the harmonic graph it is noted that there is a small amount of ground current leakage due to load unbalance which is evidenced by a small increase in the calculated fundamental current compared to the measured fundamental current. The majority of the leakage current is found at the 9th harmonic. The next step is to determine which load is causing the problem by moving the measurement equipment to downstream loads until the load with the leakage current has been identified.
PVII™ is a robust, easy to use software package that is very versatile for presentation, analysis and report generation of recorded power quality and energy data.
RMS values of the three phase currents cannot be used to accurately calculate neutral current however waveform data can be used to precisely calculate neutral current. To test this a PQPro™ was used with 10A clamp CTs for phase currents and a 30A clamp CT for neutral current. The test load was a set of 3 CFL bulbs that generated significant current harmonics. Ten turn coils were used on each phase and neutral to magnify the small CFL currents.
PVII™ software, which is used for displaying and analyzing PQPro™ data, can display both measured and calculated neutral current at the same time. Following are waveform and RMS graphs for measured and calculated neutral currents. The precision is such that one trace is overlaid on top of the other.
In a three phase four wire power system with a balanced load and without harmonics there will be no current flowing in the neutral wire. If the load is unbalanced and/or there are triplen (3rd, 9th, 15th etc.) harmonics in the phase currents there will be current flowing in the neutral. Typically the neutral wires in a building will all connect to ground at one central place, usually at the main distribution panel. Wiring errors or insulation breakdown can allow neutral currents to shunt to ground without going through the neutral conductor. This is not a safe situation. Comparison of the measured and calculated neutral current can quickly identify this situation. Following is an example from a data centre distribution panel.


The above graphs show that a downstream load has neutral current that is leaking directly into ground instead of going through the neutral conductor. From the harmonic graph it is noted that there is a small amount of ground current leakage due to load unbalance which is evidenced by a small increase in the calculated fundamental current compared to the measured fundamental current. The majority of the leakage current is found at the 9th harmonic. The next step is to determine which load is causing the problem by moving the measurement equipment to downstream loads until the load with the leakage current has been identified.
PVII™ is a robust, easy to use software package that is very versatile for presentation, analysis and report generation of recorded power quality and energy data.