


Case Studies > Servo Press Monitoring
Monitoring the electrical characteristics of the input to a servo press is a demanding prospect. Current can change from no load to full load in a fraction of a second. The press can go from absorbing power to generating power in a few cycles. CANDURA’s PQPro™ with PV II™ software is the ideal tool for capturing and analyzing detailed power system information.
In this example a PQPro™ was used to monitor the electrical input to a 5000 ton Servo Press. The Servo Press has a dedicated 4MVA transformer connected to a medium voltage distribution system. It also has built in short term energy storage in the form of capacitor banks.
The PQPro™ was configured to record 3 phase voltage and current at 256 samples/cycle using Continuous Waveform recording. With Continuous Waveform recording there are no gaps in the waveform recording and consequently no trigger level settings are required in order to capture high resolution data. After the data is recorded PV II™ software is used to graphically analyze the data. Due to the extremely fast changes in current magnitude and phase Continuous Waveform recording is the only way to get an accurate measurement of the load.
The servo press was used in a metal stamping application where each production cycle took about 6 seconds. Figure 1 shows the current loading of the servo press over one production cycle.
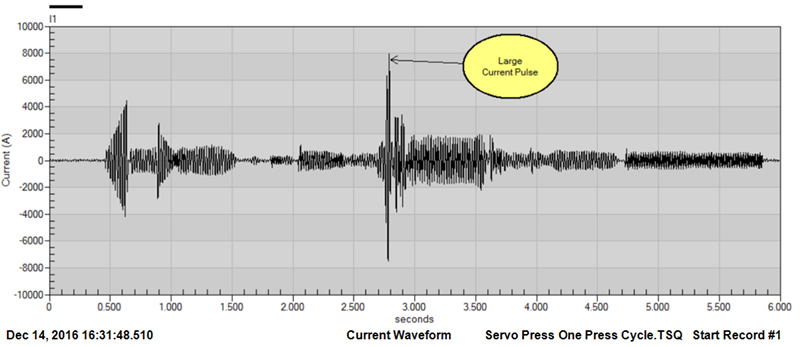 Figure 1: Phase A Instantaneous Current – One Production Cycle
In the middle of the cycle there is a large current pulse. Figure 2 shows this large current pulse in more detail. This large current pulse only lasts for 1 ½ cycles.
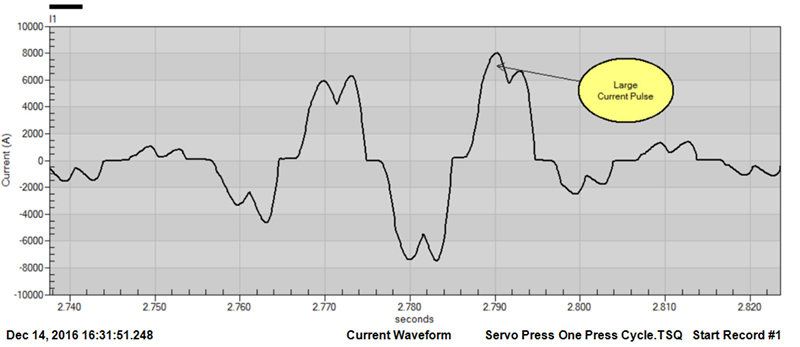 Figure 2: Phase A Instantaneous Current Pulse
Figure 3 shows instantaneous voltage and current for a short period of time (less than ¼ second) where the drive goes from motoring to generating and back again.
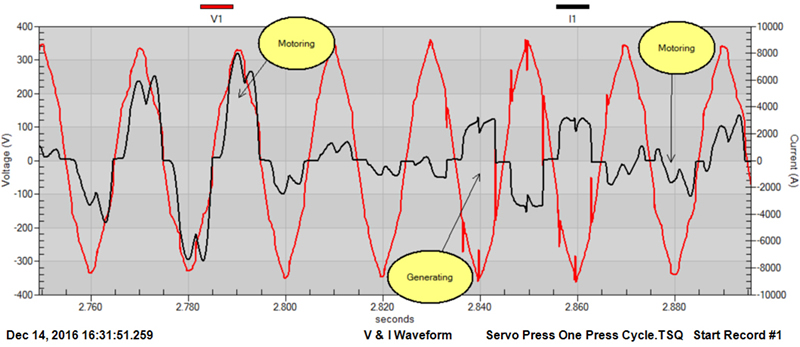 Figure 3: Phase A Instantaneous Voltage and Current with both motoring and generating operation
Figure 4 shows the instantaneous power flow. The peak power requirement for this process is 4.2 MW. During negative power flow the drive is braking and generating power. The electrical supply to this press must be able to deliver 4.2 MW and absorb 2.2 MW. Instantaneous power is calculated from the voltage and current waveform data which has a resolution of 78 microseconds. Figure 5 shows the power flow based on power measurements averaged over 240 milliseconds. Comparing the two graphs shows that for this application it is important to monitor the instantaneous power flow.
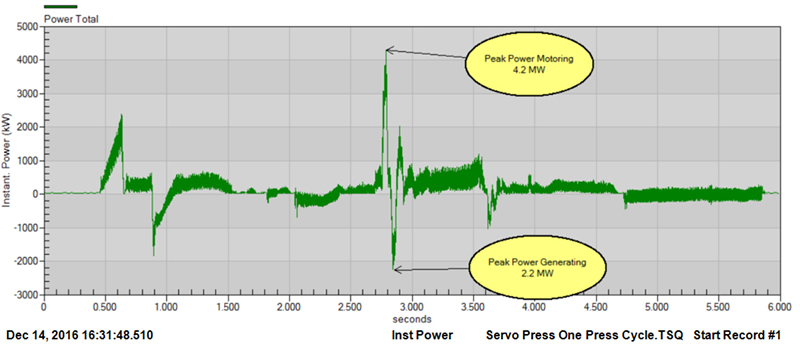 Figure 4: Total Instantaneous Power
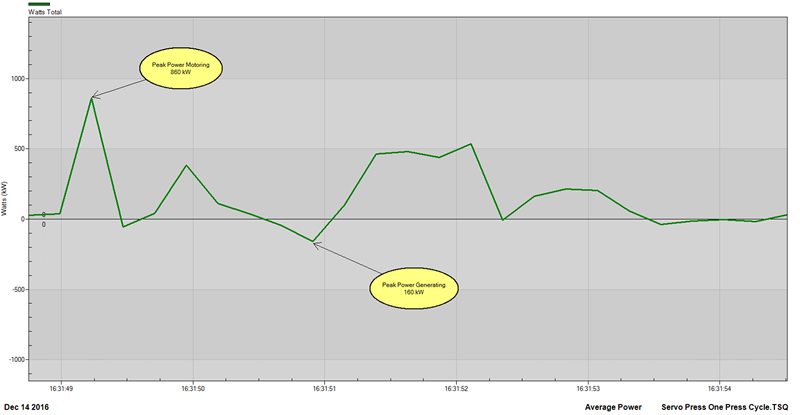 Figure 5: Total Power averaged over 0.24 second windows
Figure 6 shows the energy used by the drive during the production cycle. The energy is categorized as “Import” (motoring) and “Export” (generating). The Net energy is the difference between Import and Export.
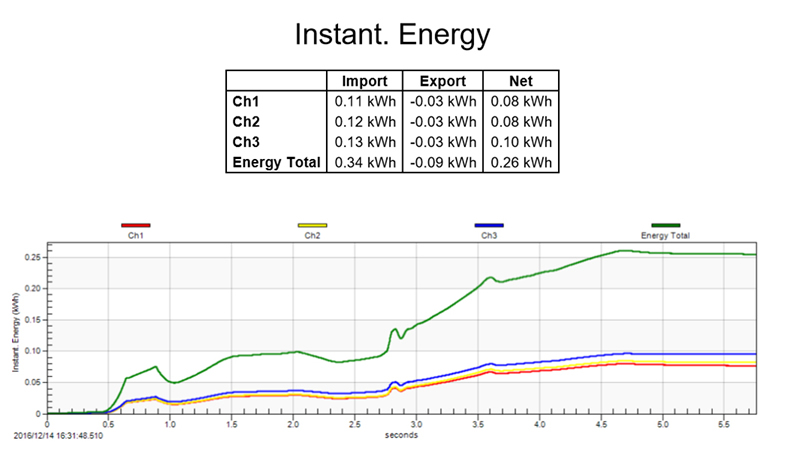 Figure 6: Servo drive energy usage during one production cycle
For fast changing dynamic loads the PQPro™ with PV II™ software enables a level of operational insight that is not available from other instruments.
In this example a PQPro™ was used to monitor the electrical input to a 5000 ton Servo Press. The Servo Press has a dedicated 4MVA transformer connected to a medium voltage distribution system. It also has built in short term energy storage in the form of capacitor banks.
The PQPro™ was configured to record 3 phase voltage and current at 256 samples/cycle using Continuous Waveform recording. With Continuous Waveform recording there are no gaps in the waveform recording and consequently no trigger level settings are required in order to capture high resolution data. After the data is recorded PV II™ software is used to graphically analyze the data. Due to the extremely fast changes in current magnitude and phase Continuous Waveform recording is the only way to get an accurate measurement of the load.
The servo press was used in a metal stamping application where each production cycle took about 6 seconds. Figure 1 shows the current loading of the servo press over one production cycle.

In the middle of the cycle there is a large current pulse. Figure 2 shows this large current pulse in more detail. This large current pulse only lasts for 1 ½ cycles.
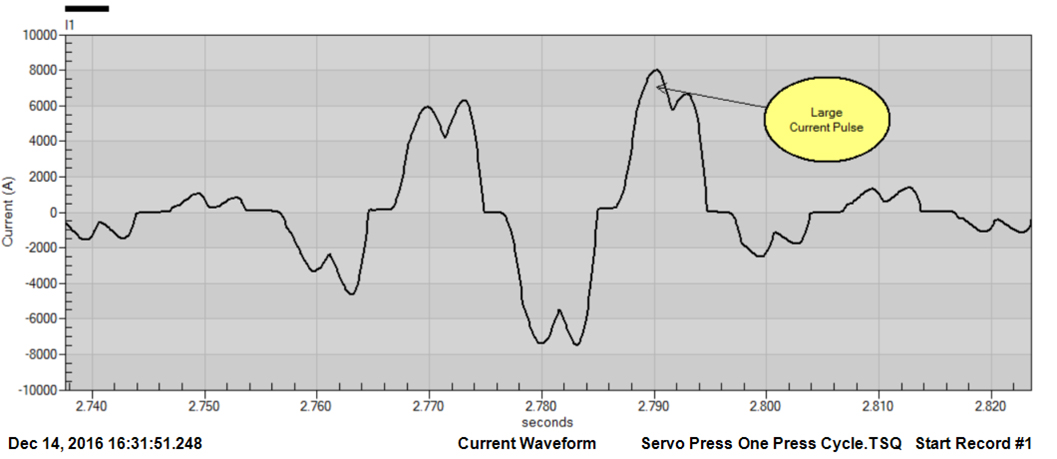
Figure 3 shows instantaneous voltage and current for a short period of time (less than ¼ second) where the drive goes from motoring to generating and back again.
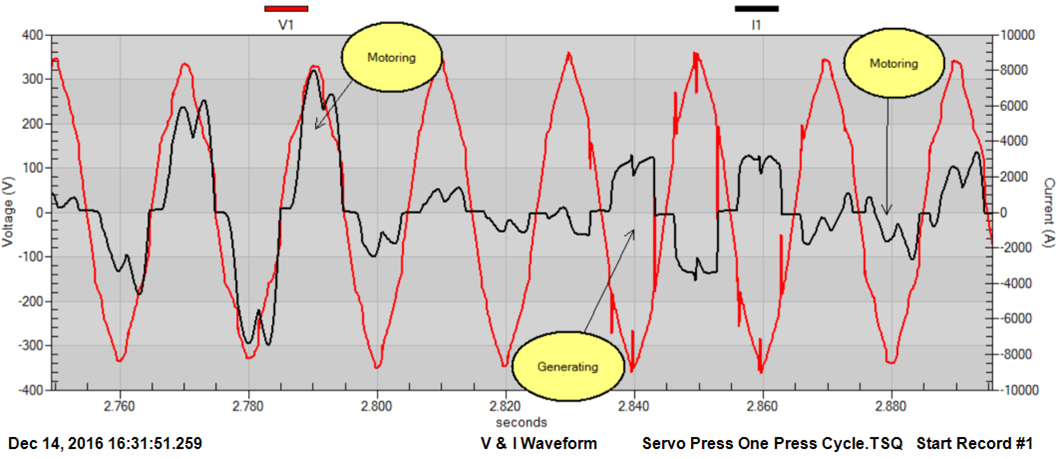
Figure 4 shows the instantaneous power flow. The peak power requirement for this process is 4.2 MW. During negative power flow the drive is braking and generating power. The electrical supply to this press must be able to deliver 4.2 MW and absorb 2.2 MW. Instantaneous power is calculated from the voltage and current waveform data which has a resolution of 78 microseconds. Figure 5 shows the power flow based on power measurements averaged over 240 milliseconds. Comparing the two graphs shows that for this application it is important to monitor the instantaneous power flow.
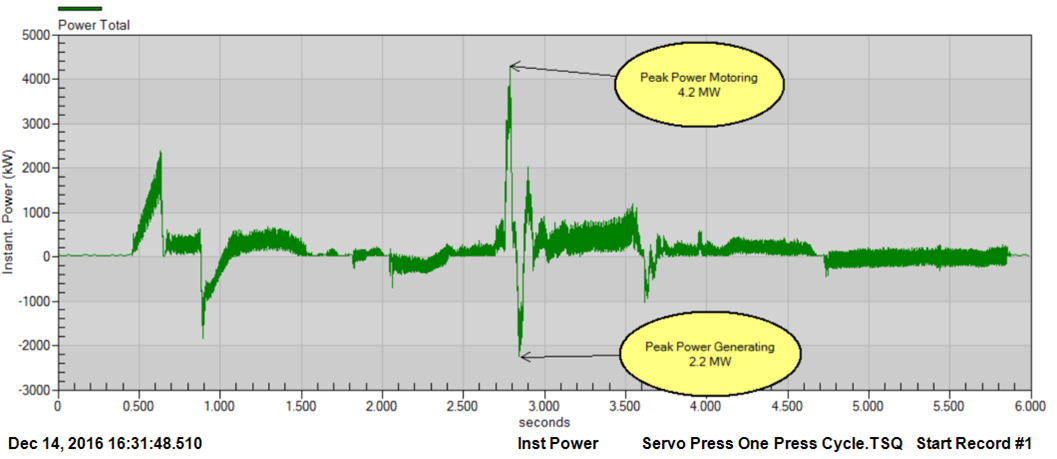
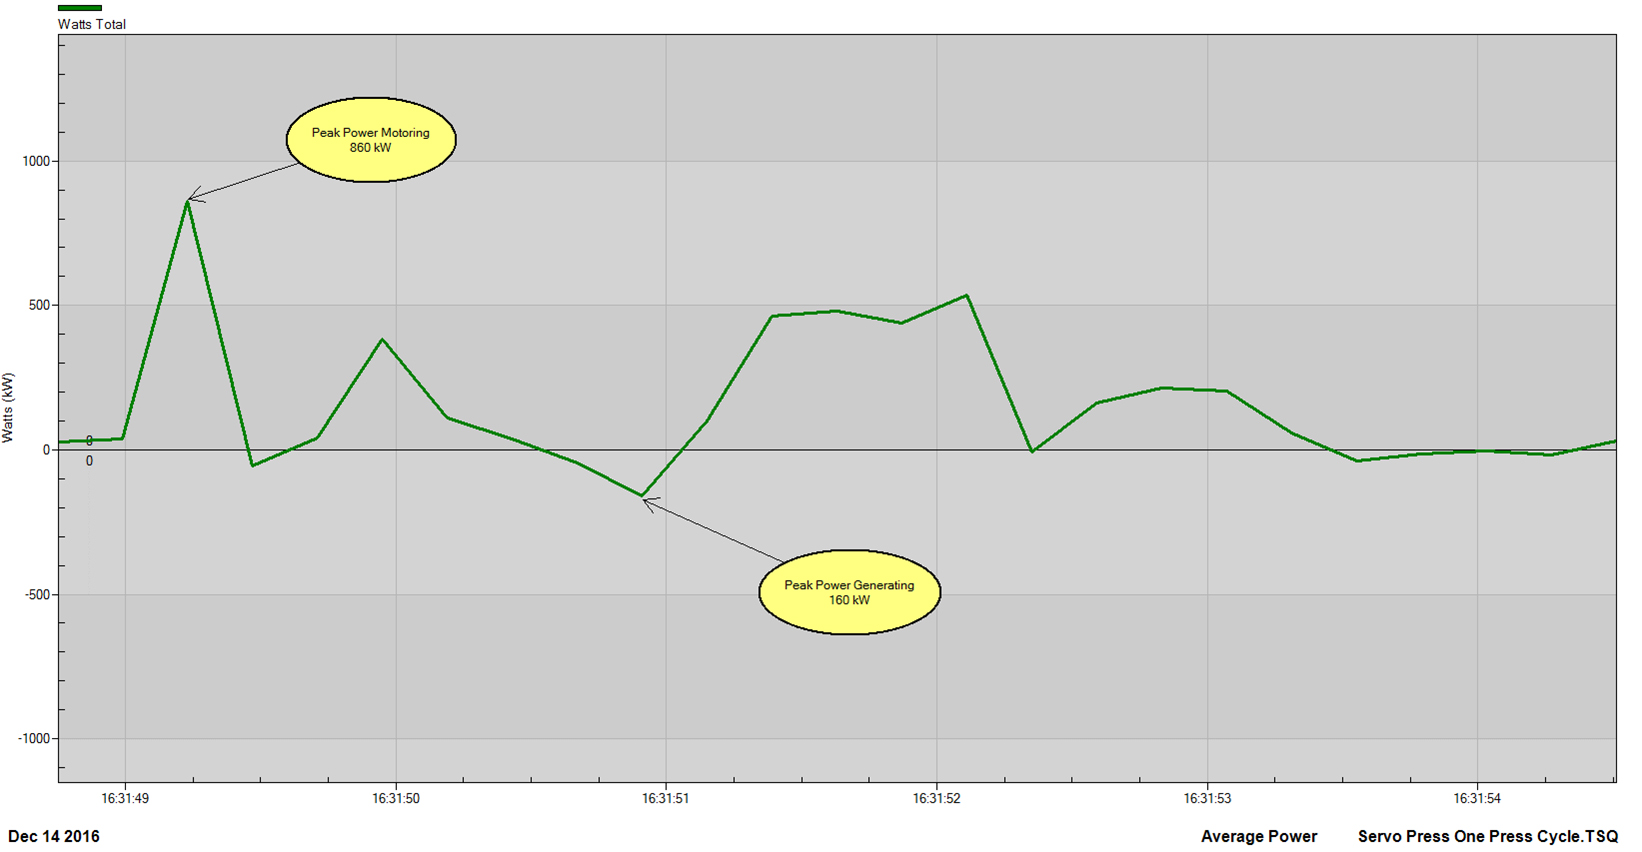
Figure 6 shows the energy used by the drive during the production cycle. The energy is categorized as “Import” (motoring) and “Export” (generating). The Net energy is the difference between Import and Export.

For fast changing dynamic loads the PQPro™ with PV II™ software enables a level of operational insight that is not available from other instruments.