1. Adusting the time scale (X axis)
The X axis dialog box is where you can modify the graph's Start and End times. Open the diaglog box either by drop down menu Setup > Graph > X Axis, or simply right clicking near the X axis.
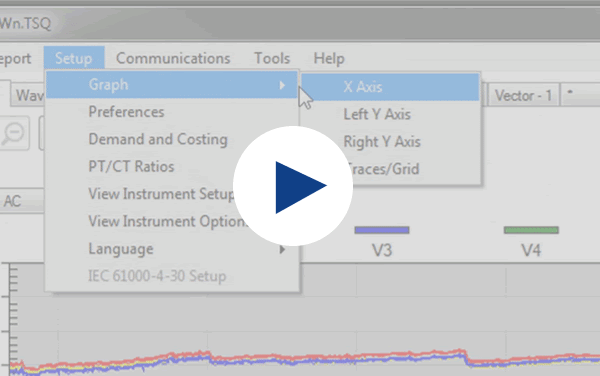 The standard way using drop down menu
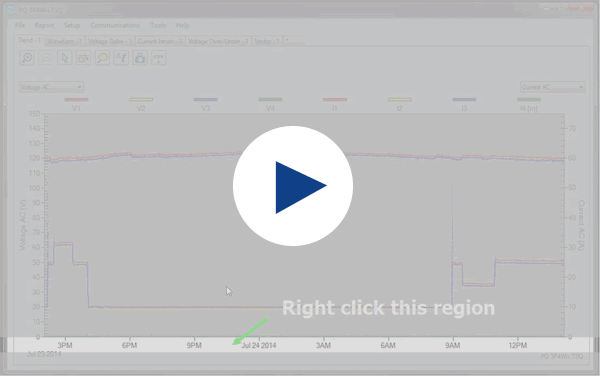 The shortcut way by right clicking near the X axis
2. Adusting the vertical scaling for left or right Y axis
Similary, open the left and right Y axis dialog box either by drop down menu, or simply right clicking near the Y axis.
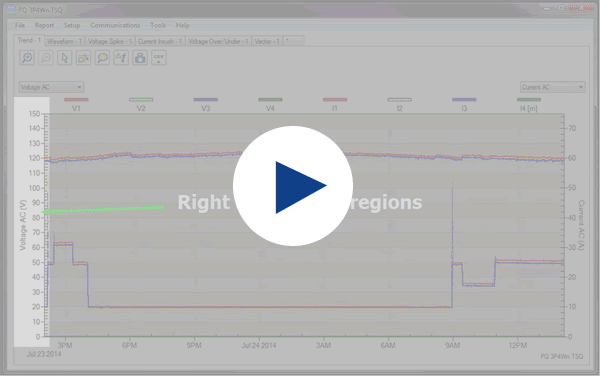 The shortcut way by right clicking near the Y axis
3. Enable/disable traces and set trace attributes
Open the Traces/Grid dialog box either by drop down menu Setup > Graph > Traces/Grid, or simply right clicking near the legend.
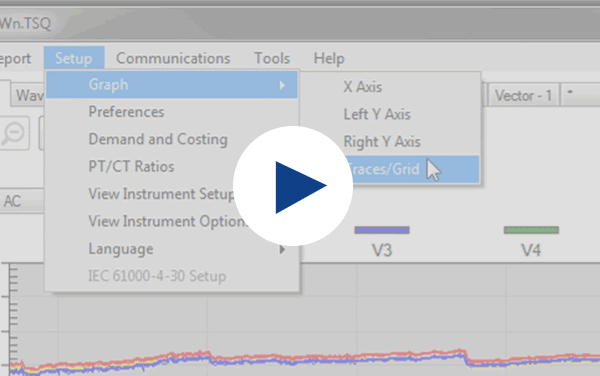 The standard way using drop down menu
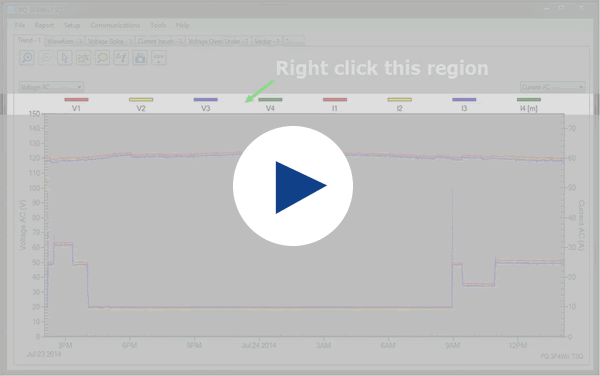 The shortcut way by right clicking near the legend
4. Events Markers
Event Markers are used to show the location of triggered events on a Trend graph.
Displaying of Event Markers can be turned ‘ON’ or ‘OFF’ at Setup > Preferences. The Event Marker letters refer to different types of events and the colours are for the different phases:
- S – High speed voltage spike
- C – Over current
- O – Over voltage
- U – Under voltage

Event Marker description box
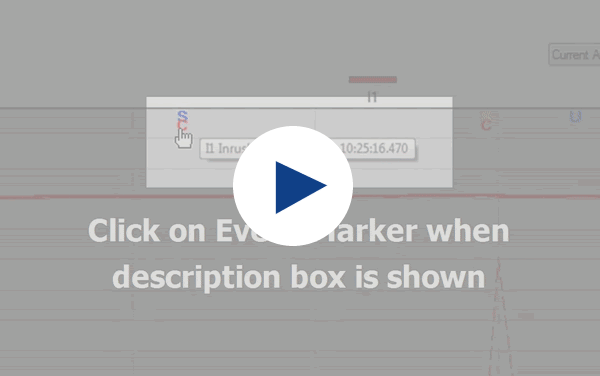 Event Marker RMS to Waveform graph
5. Quickly open a Waveform graph
If there's an area of interest in the trend graph and you wish to view the waveforms, simply hover to the desired location and right click.
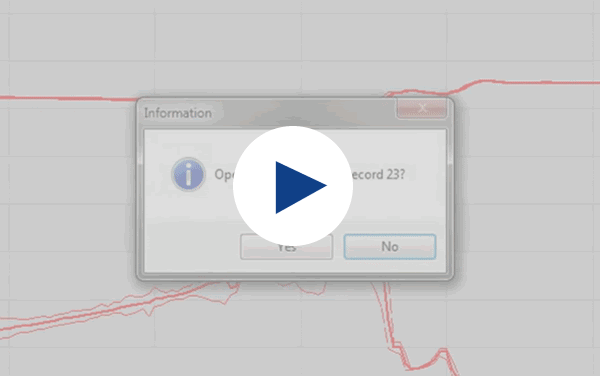 Open Waveform tab at specific record #