


Speed Buttons
Adding annotations to PVII™ graphs is an effective way to enhance the graph's presentation in a report. Graph annotation can be added by using some of the speed buttons in PVII™ as shown below.


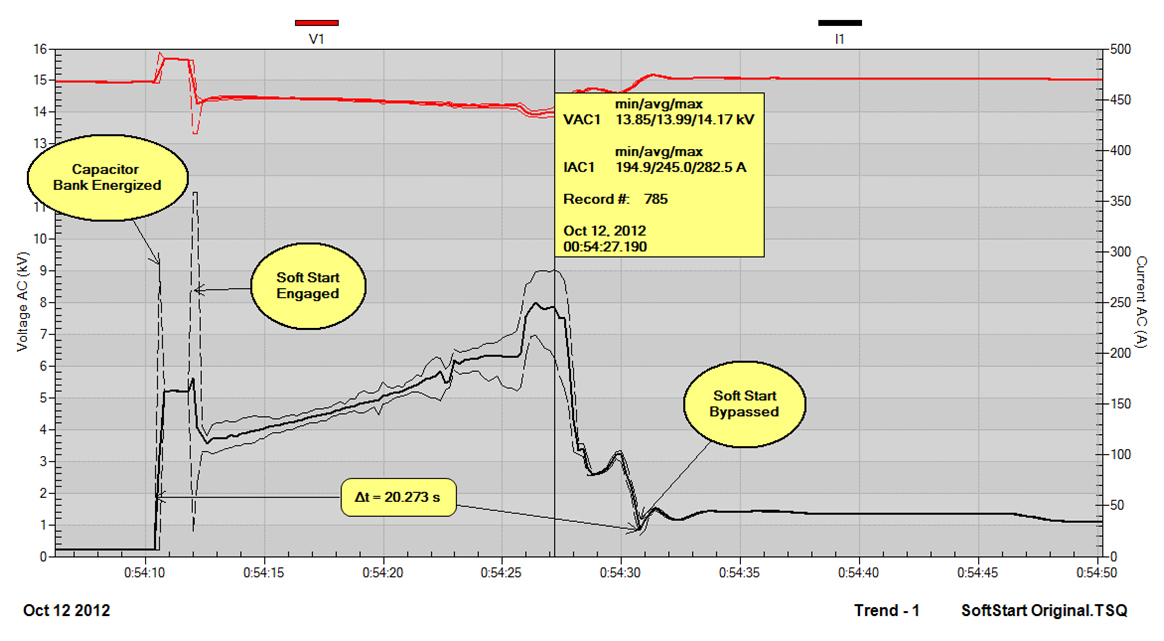
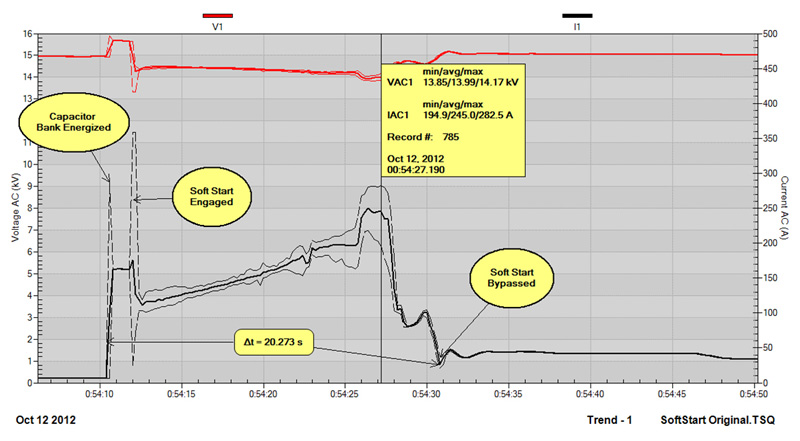
The following is a graph annotation example. The purpose of this recording was to determine the effect of a 5500 HP induction motor start on a relatively weak power system.
During the motor starting sequence a power factor correction capacitor bank is connected first. About a second later the Soft Start is energized. When the motor reaches synchronous speed the Soft Start is bypassed. Text Bubbles are added to highlight these three operating points. A Databox is added near the end of the start process to show the variation in the current at that point. A Delta Time Box shows that it took about 20 ¼ seconds for the motor to spin up from standstill to synchronous speed.
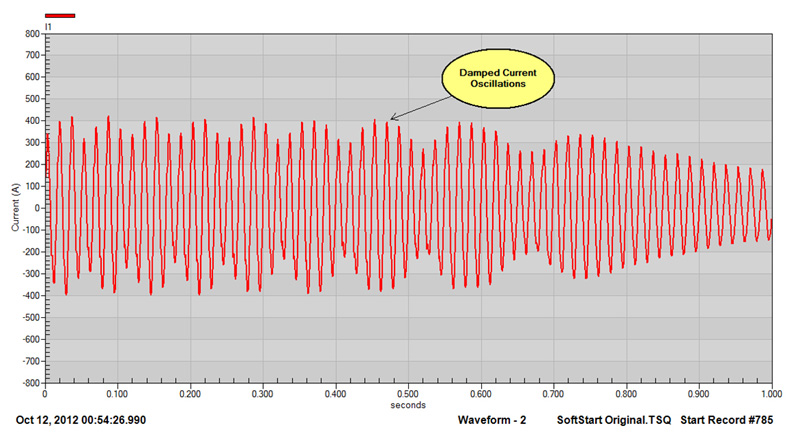
We can also examine the instantaneou waveforms at Record #785 since there is a large difference between the Maximum and Minimum RMS current (as shown in the Databox). This can be done quickly by right clicking on the graph at the location where the Databox is pinned.
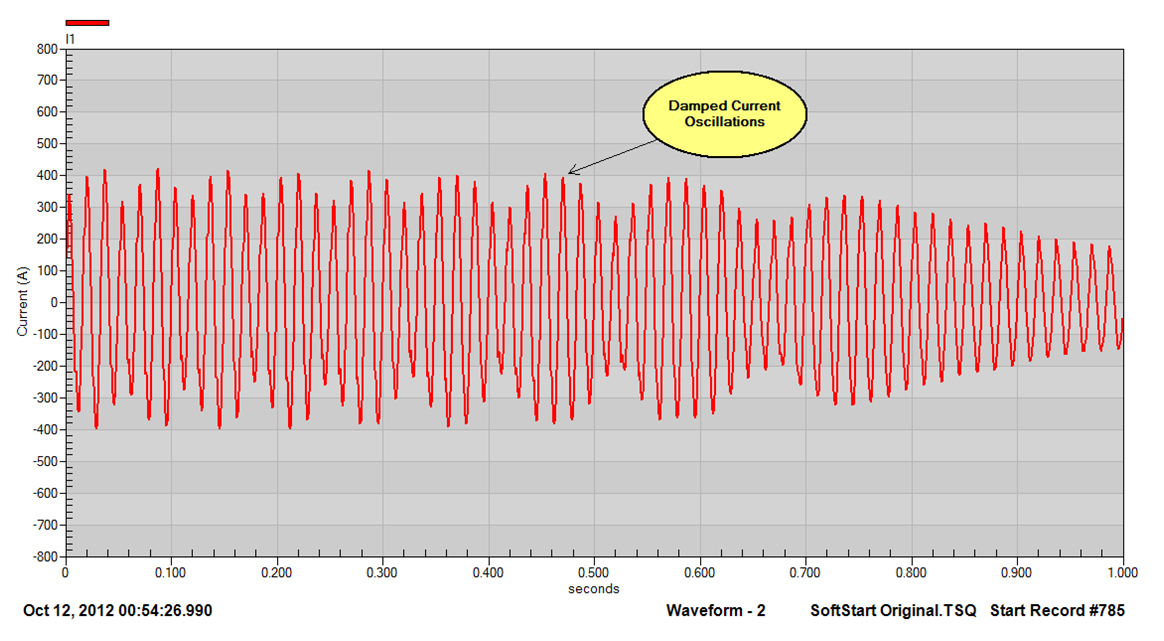